I've been playing with data from the Project365 group I am a member of. I would usually do this analysis using some combination of perl, ruby, and unix shell (sort, uniq etc). This time I thought I'd stretch myself a bit.
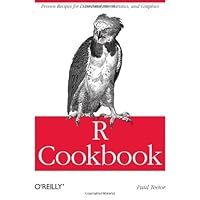
These are the two books I've been using to learn "R". Why R? Apart from being 'interesting' to google for, "R" is distinguished by often popping up on the visualisation blogs I subscribe to. It also offers another way to slice and dice data. Although I can achieve some of these things in a combination of Excel and shell, it always feels very brittle and throwaway. R offers the hope of some re-usability, or at least, repeatability.
Taking the Project365 data as a driving example, I plunged into learning R.
From a first pass, "R" is definitely 'new Lego': lots of large pre-formed parts that look great, when they fit. However, it doesn't really feel like a cohesive language. For example, what do you think as.vector() does? It sounds like it should always return a vector, yes? Nope, it tries its best, and if it doesn't work, well, then you get back what you put in. There may be a perfectly valid reason for this, but it still feels 'perly'. I like my languages to tell me when something hasn't worked.
If you follow along with the documentation, then you can get a lot done. However, I found myself often falling flat whenever I tried to generalise; it did not follow the principal of least surprise.
There is power there but it is often frustrating getting to it. I'm going to leave it for a bit before I dive back in.


